BI Dashboards

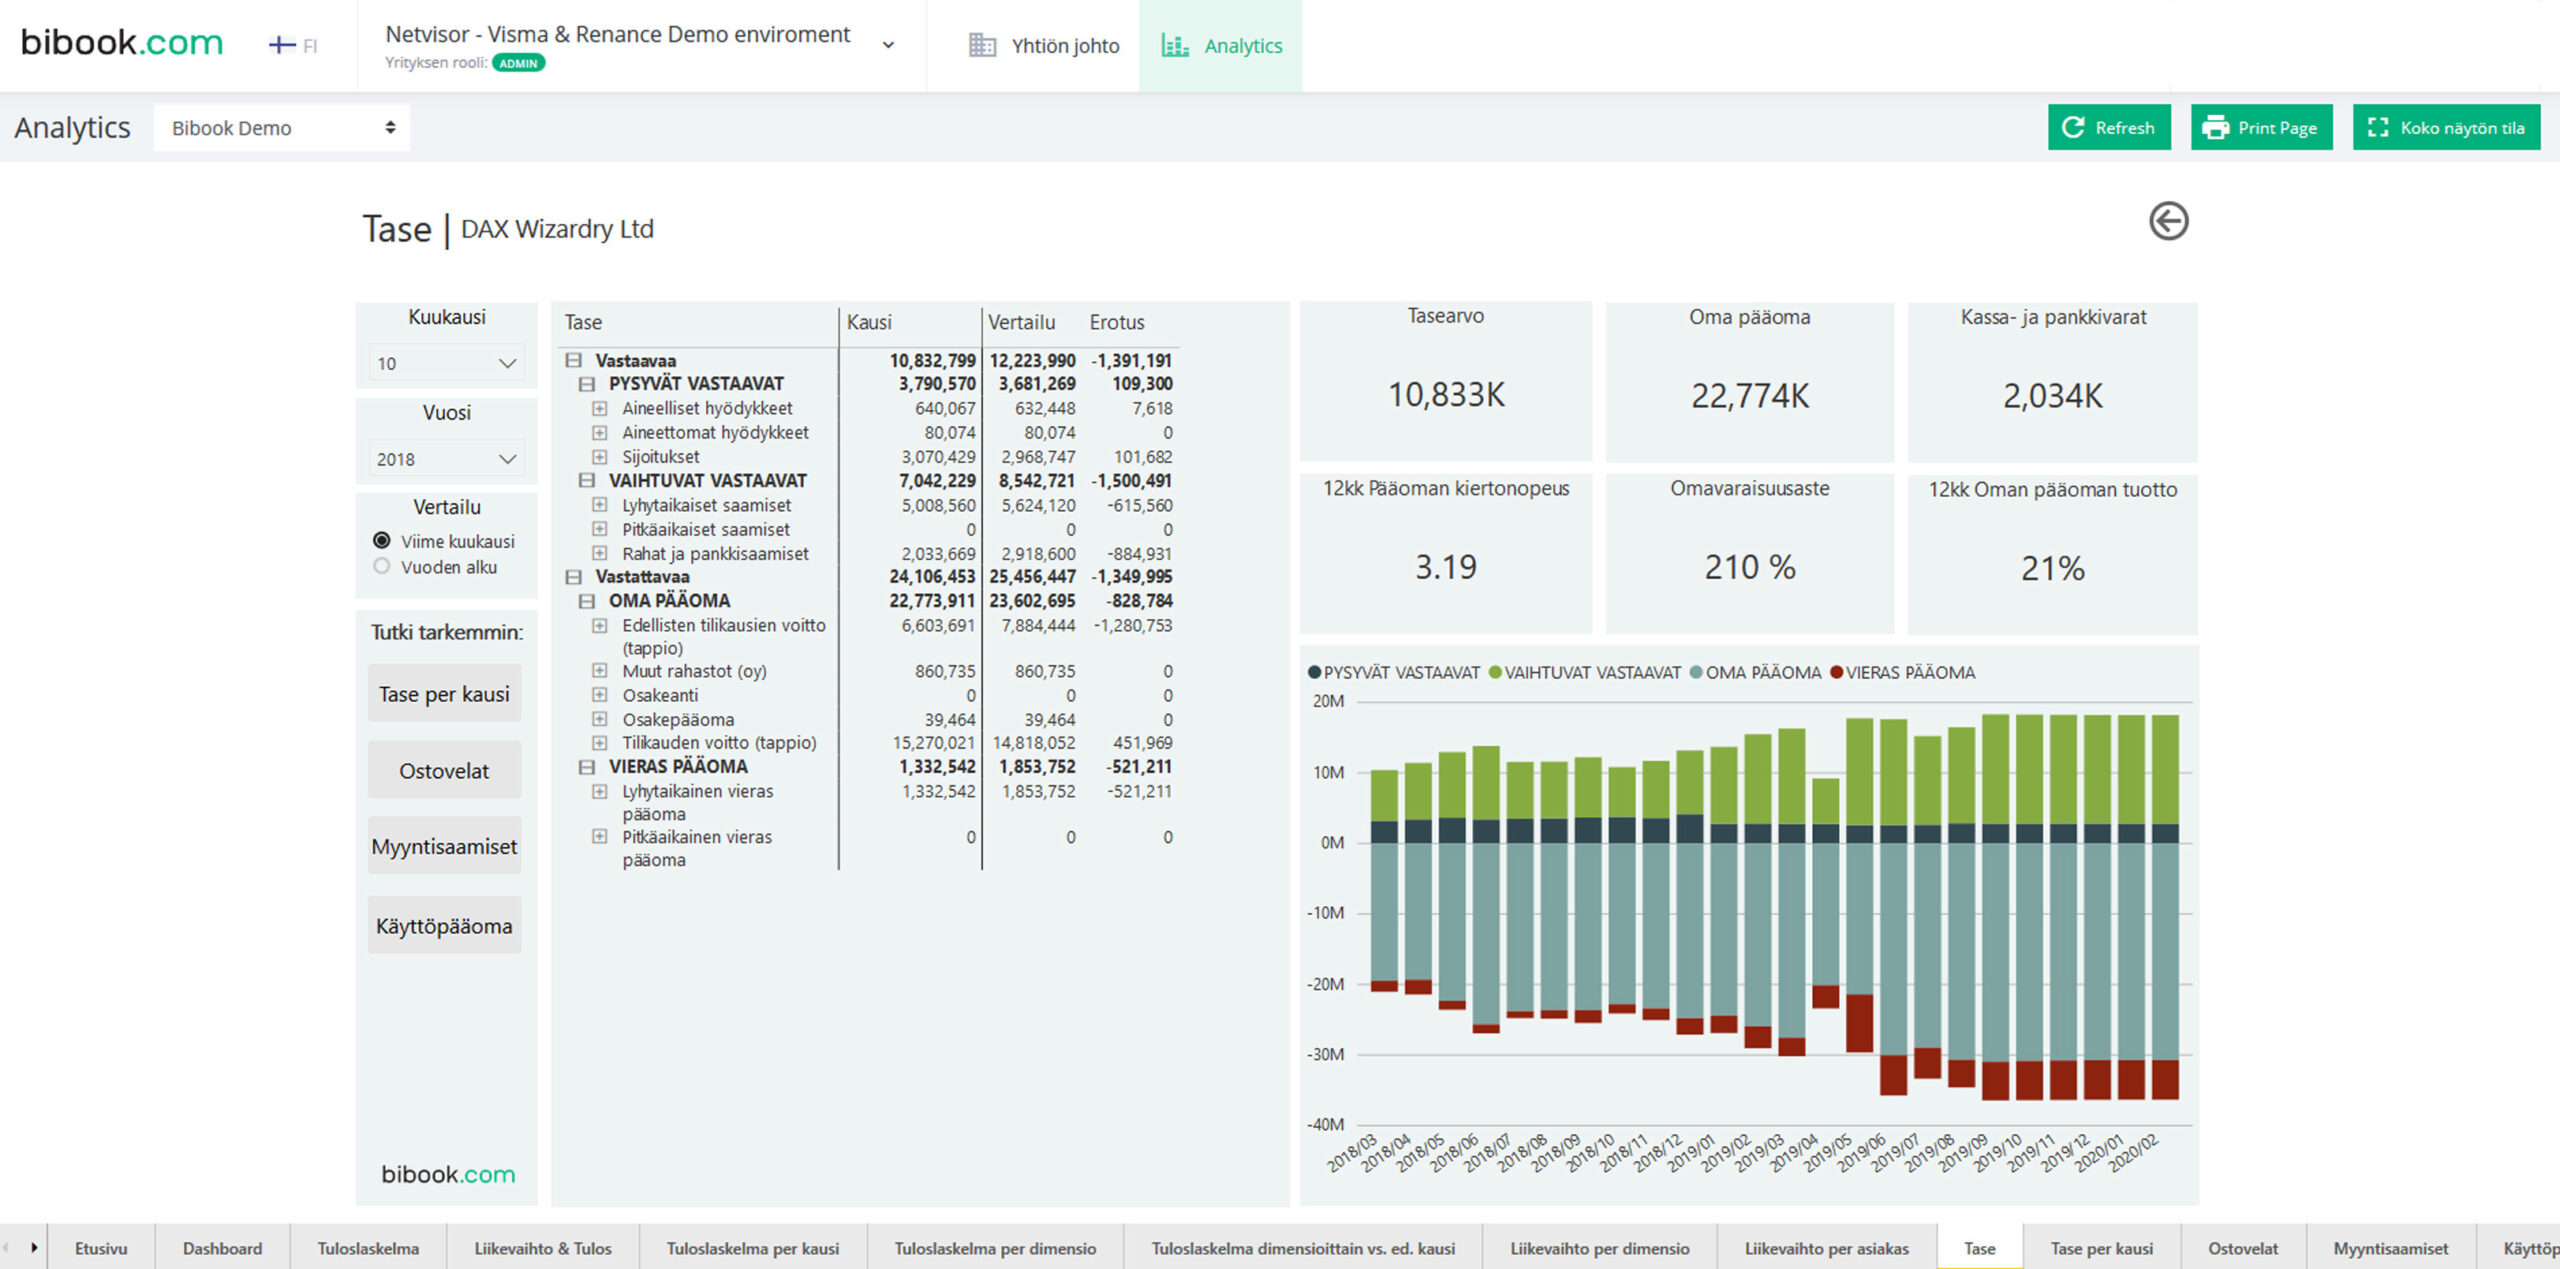
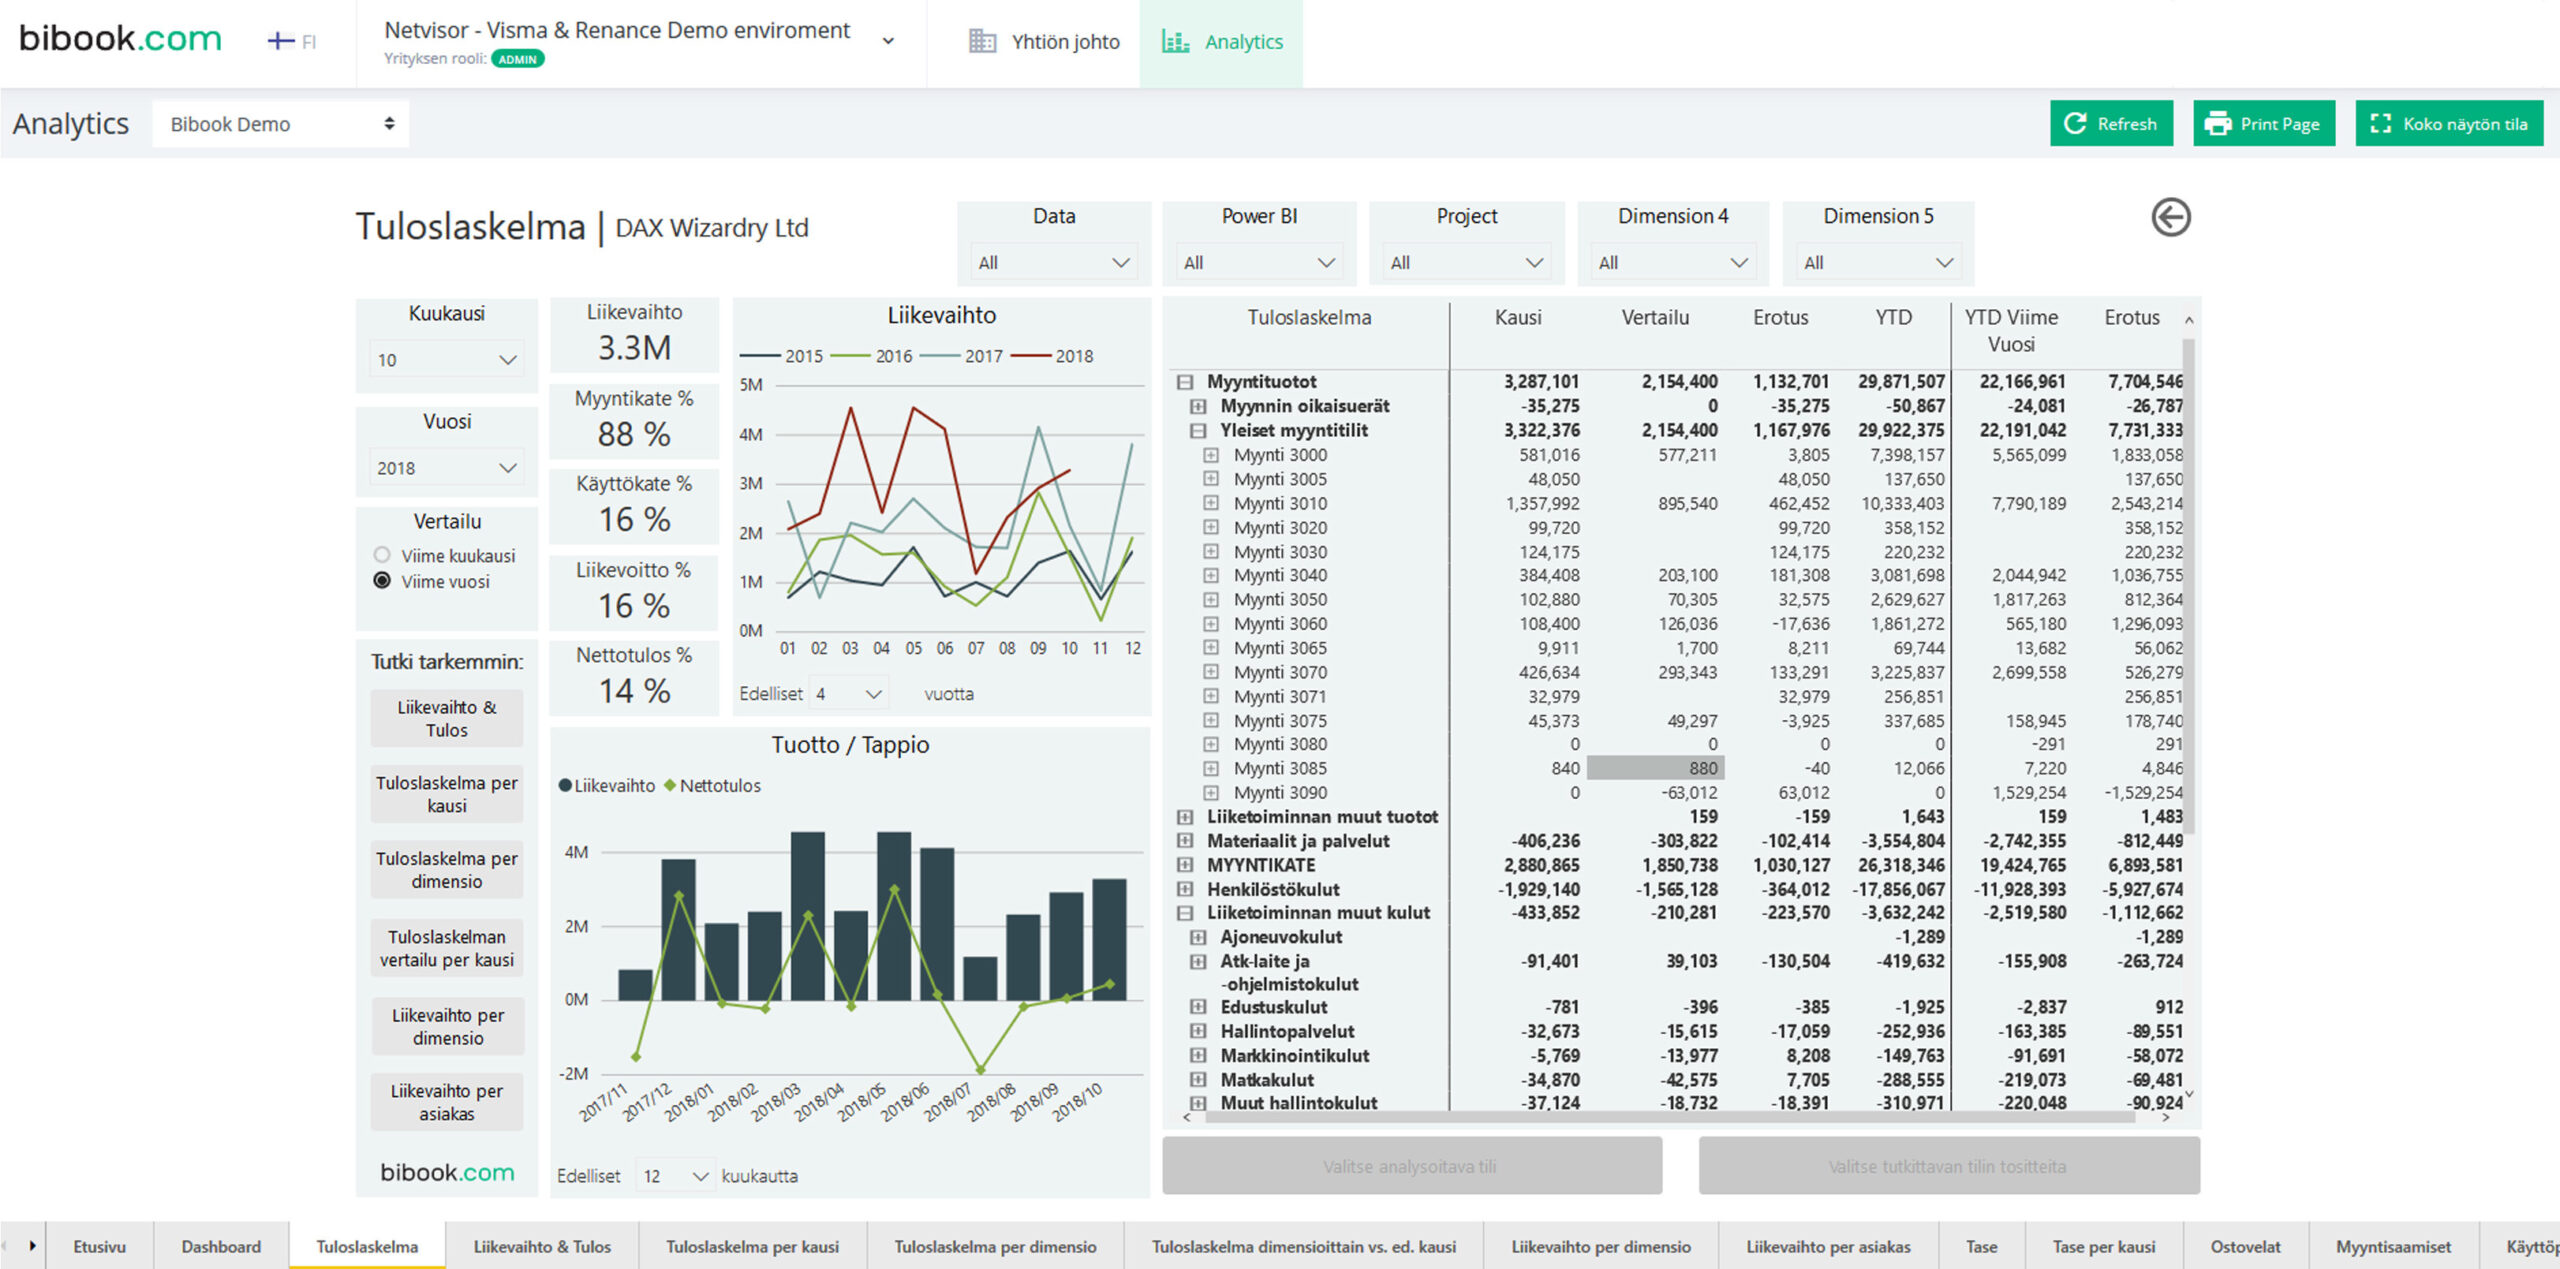
BI reports are views of Business Intelligence systems that allow you to conveniently share business data with users who need it. Reports help you present figures in a visual and easy-to-understand format. The views are interactive, as the user can filter and change analysis methods with a touch of a button.
The BI reports created by Greenstep are always based on the Microsoft Power BI system, which is the most popular and versatile BI system on the market. With Power BI, the reporting system is developed daily with the benefit of significant investment. In practice, using Power BI means that users can always drill down in reports. In this way, for example, an examination of financial figures can extend to the invoice or document level rather than remaining static as an overview.
With Greenstep, BI reports can be completely customized to the systems used by the customer. Data warehousing and integration services, which go hand in hand, are almost always included. BI reports are often a visible part of analytics projects for the customer as they serve as an easy-to-use interface. On top of Power BI, we have also created our own user interface, BiBook, which is already used by more than 100 satisfied customers
BI reports are for you if you want to:
- Get more from reporting
- Combine different data sources
- Maintain reporting of your organization in one place
- Improve the quality of reporting
- Eliminate manual steps in reporting
- Ensure reports can be shared easily
- Reduce reporting time
- Combine the reporting of various entities in the company
- To stop wasting too much time in Excel